Quick answer
Job comparison only: same ROI math, different cost drivers and payback bands by application—method stays in the ROI guide; line items in the Cost guide
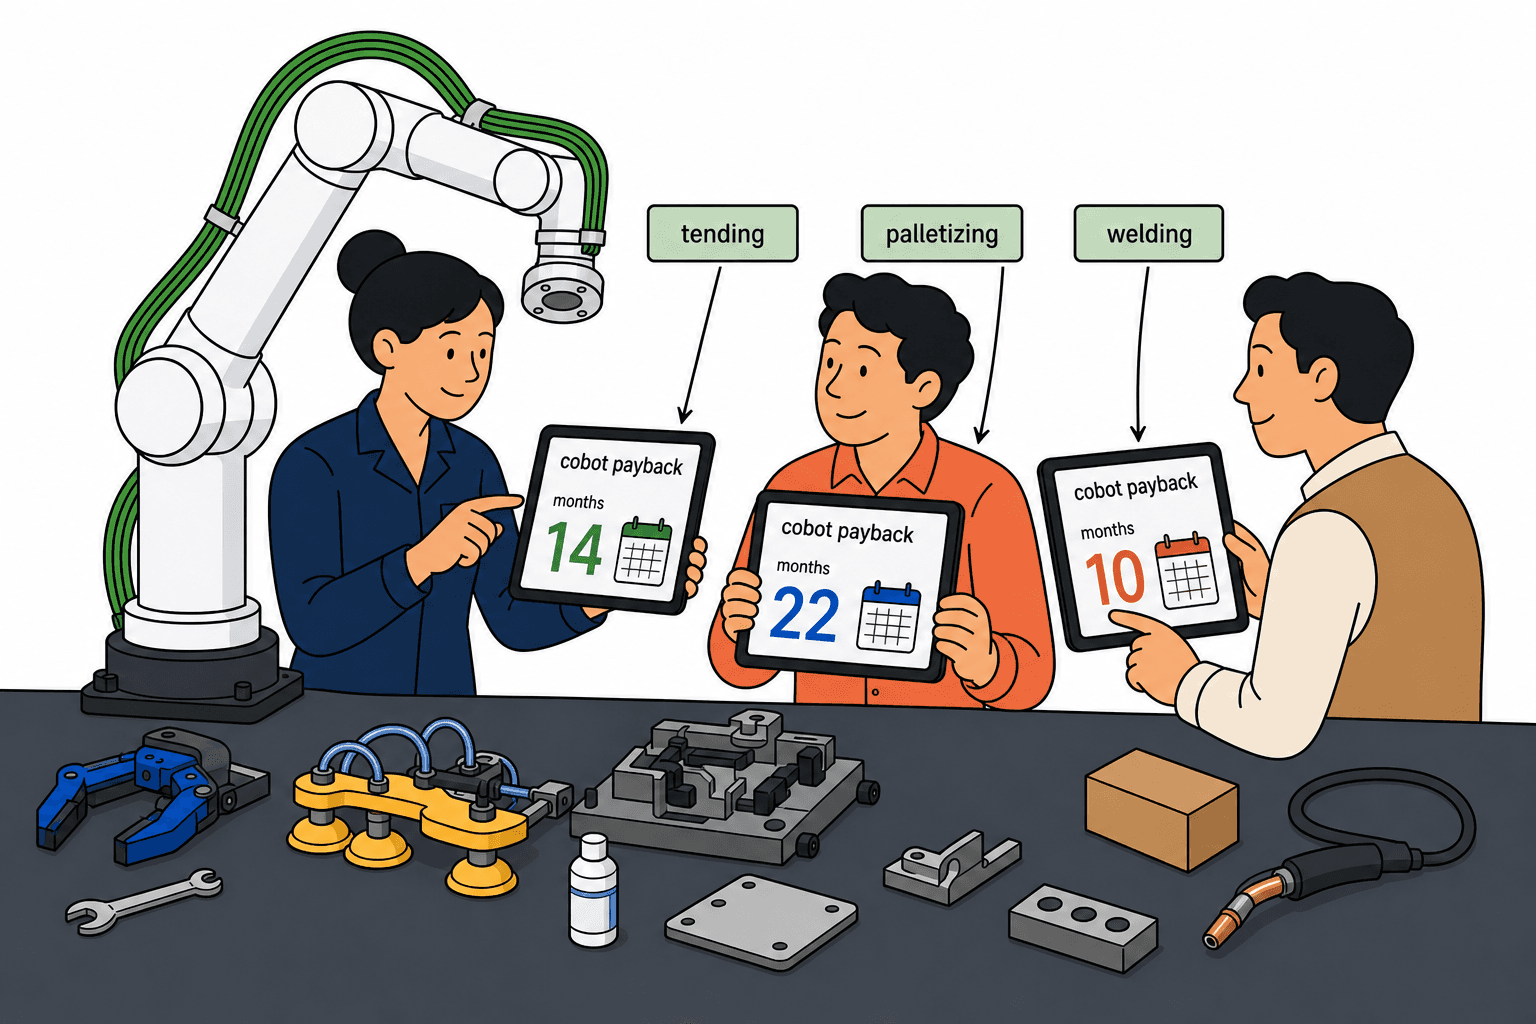
Published medians (Robotomated · 200+ deployment narrative): tending / palletizing in the fast ~10–14 month band; cobot welding median ~12 months; all-apps median ~18 single-shift / ~11 two-shift
CobotFinder: cross-app median ~8–12 months; best cases ~3–5, weak cases ~16–20
GrabaRobot: cobots often ~6–18 months; palletizing-robot examples ~12–24; welding-robot examples ~12–30 (do not mix class labels with cobot cells)
Why tending often wins: high machine-hour rates and multi-shift / lights-out windows count new capacity, not only “replace one person”
Procurement fights start with “how fast does a cobot pay back?” Machine tending, palletizing, and welding do not share one Year 0 stack or one gain ledger: one buys spindle time, one buys backs and overtime, one buys weld rework. This page compares the three jobs. It does not rewrite the spreadsheet method—but it does make “same formula, three columns” meeting-ready.
First: what are you actually comparing?
Three fake comparisons show up in almost every review:
| Fake compare | Why it lies | Fix |
|---|---|---|
| Arm price vs full cell | Palletizing/welding EOAT and peripherals dwarf the arm | Put full-cell Year 0 in every column |
| Single-shift labor vs two-shift capacity | Shift assumptions differ | Freeze shifts, then rank jobs |
| Cobot median vs industrial weld example | Different robot class | Compare inside a class; label cross-class rows |
Ask before the meeting: are we comparing full cells under the same shift and acceptance rules—or brochure numbers? The second does not need a meeting.
Published payback bands (paste the numbers)
| App / frame | Published band | Source |
|---|---|---|
| Cobot tending (median cell ~$55k) | Median ~10 months | Robotomated ROI study |
| Cobot palletizing (median cell ~$85k) | Median ~10 months | Same |
| Cobot welding (median cell ~$90k) | Median ~12 months | Same |
| All deployments 1-shift / 2-shift median | ~18 / 11 months | Same |
| Cross-app cobot median | ~8–12 months | CobotFinder ROI |
| Cobot coarse band | ~6–18 months | GrabaRobot ROI guide |
| GrabaRobot CNC tending example | ~$44k invest, ~$136k/yr net, ~3.9 months | Same (named example, not a mean) |
Treat these as sanity checks. Utilization, integration scope, and acceptance rules in your contract can double or halve payback. Also note: Robotomated’s “median cell cost” already sits inside that study’s full-cell narrative. If your quote is still “arm only,” your sheet is systematically optimistic.
Why tending is often fastest
Tending gains usually stack two layers: freed operators, and machine hours no longer waiting on people. CobotFinder’s narrative cites machine utilization running ~40–55% longer and, at ~$150–$300/hour machine rates, roughly $12k–$25k/year per machine—publisher bands, rewrite with your rate card. Two-shift or weekend unmanned windows count hours that did not exist before, which beats single-shift labor-only math.
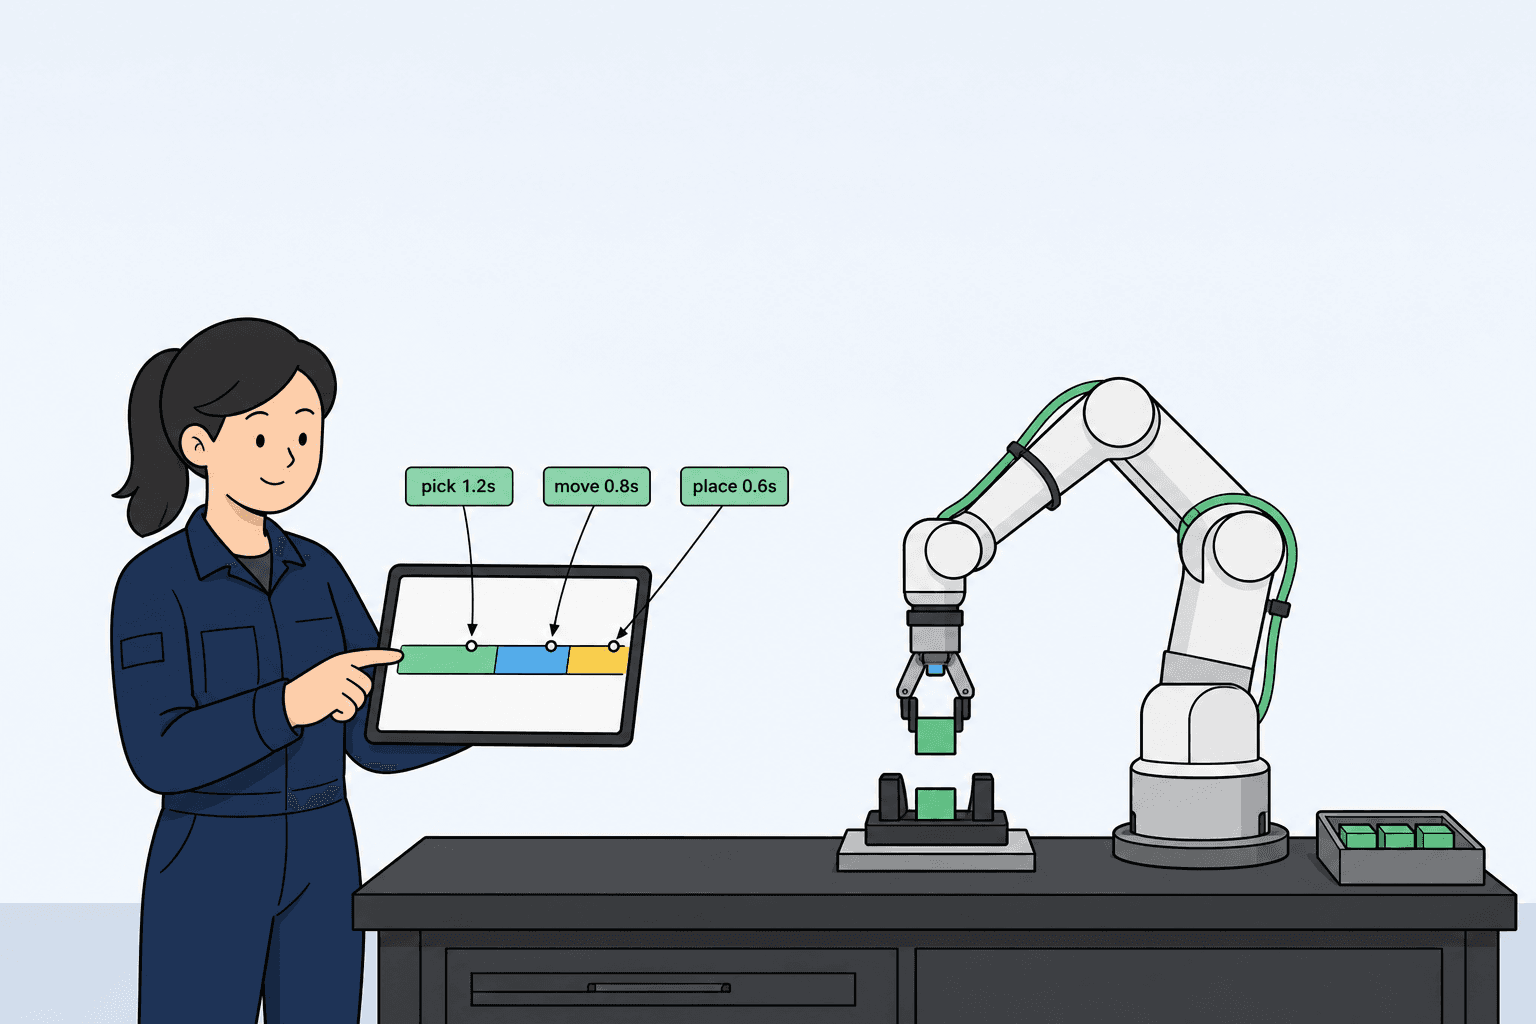
Sketch structure (replace with plant numbers): machine rate $200/hour × 2 extra hours/day × 250 days ≈ $100k/year capacity side; plus one operator-related cost (wage + overtime + hiring friction) at ~$45k/year. At ~$80k Year 0 full cell, capacity + labor alone can push payback near ~7 months—only if door signals, dual grip, and changeover waits sit in acceptance, not demo takt. CNC detail: CNC tending; one arm, two machines: Dual CNC.
Palletizing: higher Year 0, more “body” on the gain side
Public palletizing full cells often land ~$50k–$120k. The expensive lines are usually vacuum tooling, pattern software, safety, and pallet-swap logic—not the arm. If the gain side only says “replace one palletizer,” you miss:
Two-shift / night overtime and temp premiums
Back injury, downtime, and hiring friction (hard to price, but insurance and absence show up)
Upstream hours saved when the end-of-line bottleneck clears
Robotomated’s ~10-month palletizing median sitting with tending implies their samples write a wider gain side than headcount alone. If your sheet has only labor, palletizing will look systematically slower. Depth: Palletizing.
Welding: pulled by the power-source pack and by rework
Robotomated’s cobot welding median cell is about $90k with ~12-month median payback—often a few months slower than tending/palletizing, not because the formula changes, but because Year 0 quietly omits power source, wire, fume, fixtures, and teach hours, while the gain side omits welder-shortage premiums and rework/NDT fails. Industrial weld cells cost more, and fencing plus dedicated fume may mean cobot is not the fastest class at all.
Rule of thumb: if the weld already needs a dedicated process window, forcing a cobot “to skip fencing” gets eaten by rework. If the pain is hiring welders for repetitive joints, cobot assist sits closer to published medians. Detail: Welding assist.
Cost drivers: where each job hides money
| App | Year 0 often under-quoted | Gain side often under-written |
|---|---|---|
| Tending | Auto door, I/O, chip/coolant, dual-grip mass | Spindle hours, changeover waits, night cover |
| Palletizing | Vacuum tool mass, pattern software, pallet swap waits | Overtime, injury exposure, end-of-line bottleneck |
| Welding | Power source/wire, fume, joint prep, teach hours | Welder shortage premium, rework, NDT fails |
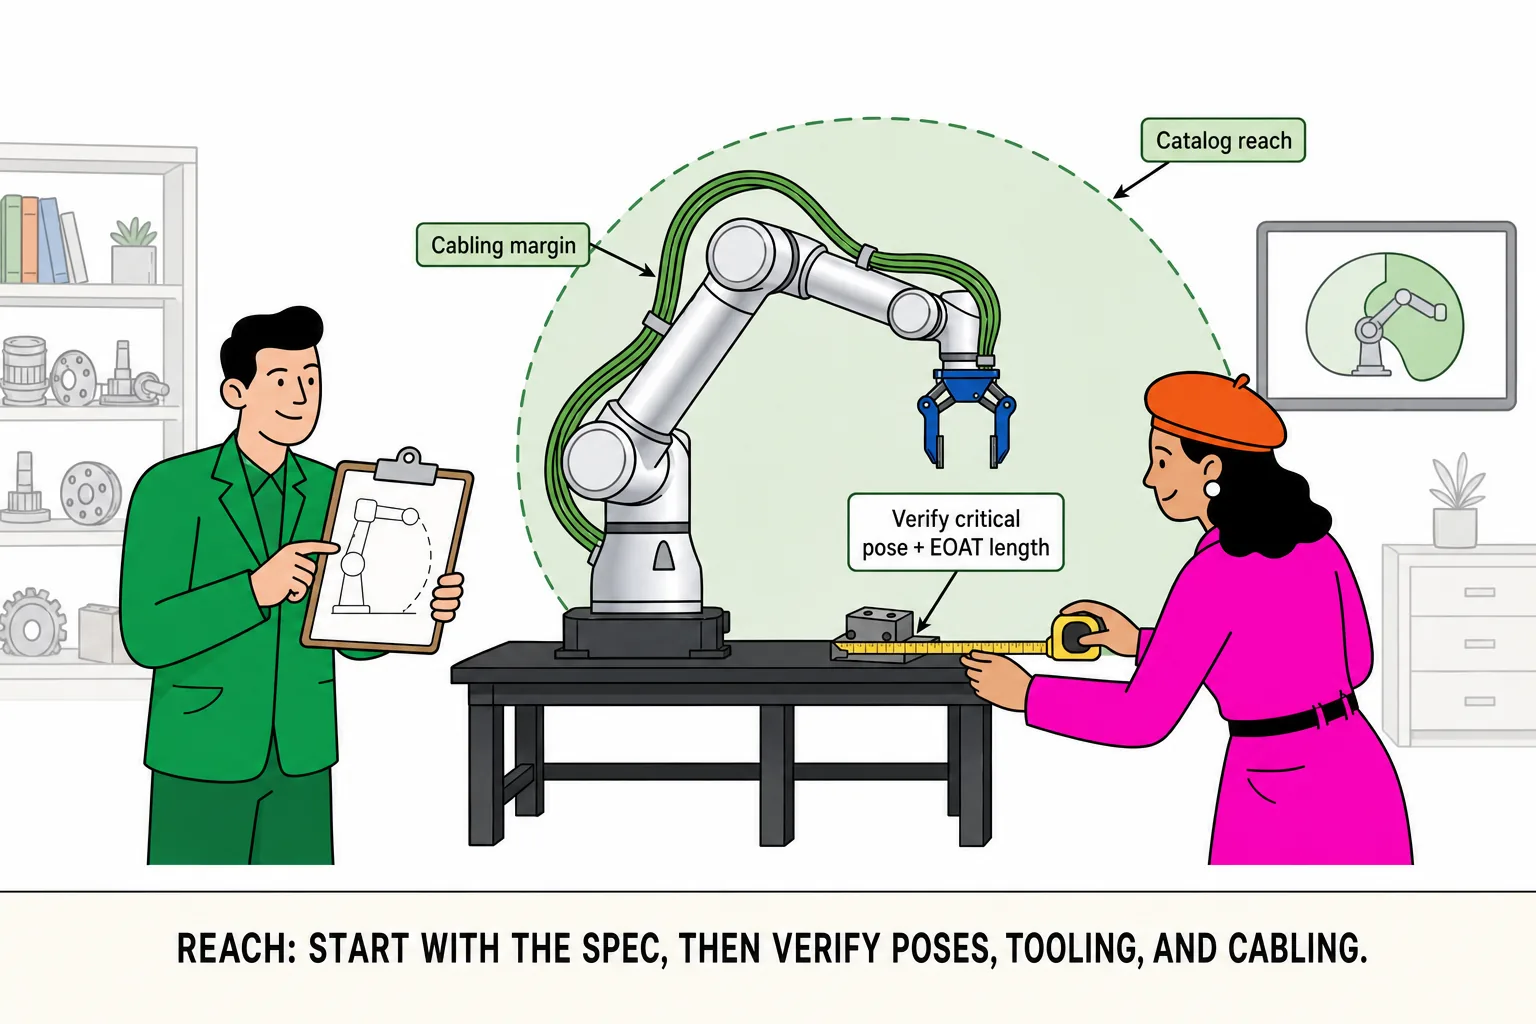
The same payload number means different things: tending subtracts dual grip and adapters; palletizing subtracts cups and plumbing; welding subtracts torch and dress pack. Shortlist reach/payload in Comparison, but the ROI sheet must use worst-case TCP mass—not brochure net payload.
How to fill your own sheet (does not replace the ROI guide)
Same formula: payback months ≈ (full-cell investment / annual net gain) × 12. The difference is which rows you include. Run three columns—tending, palletizing, welding—each with:
Year 0 (arm, EOAT, peripherals, integration days, safety, freight/training)
Annual OpEx (spares, energy, recipe/pattern maintenance)
Annual gains (labor, quality/rework, capacity hours)
Shift and unmanned-window assumptions (written down)
Utilization source (last 8–12 weeks real uptime, not brochure)
Put integration person-days in the SOW so “includes commissioning” does not silently erase a $25k–$50k mid-band. Method overview stays in the ROI guide; missing quote lines in the Cost guide.
Shifts are the biggest accelerator
Robotomated’s all-app median moves from ~18 months on one shift to ~11 on two. If the shift assumption is wrong, the job ranking is fiction. Freeze “how many shifts, how many unmanned hours, who clears faults” before arguing which application wins.
Sensitivity: three knobs before another slogan
When the ranking will not settle, twist three knobs on the same sheet:
| Knob | Twist | Common result |
|---|---|---|
| Shifts | 1 → 2 / weekend window | Payback moves forward hard (public all-app medians already hint) |
| Utilization | Brochure 85% → 8–12 week mean | Tending gain side is most sensitive |
| Integration scope | Verbal turnkey → SOW days | Year 0 up, payback out |
If twisting the three knobs flips the ranking, you have not frozen contract assumptions—do not bet the job yet.
When not to force a cobot
Extreme-takt palletizing, heavy far-corner stacks, or weld cells that need industrial fencing and dedicated fume systems may pay back faster in another robot class. Split: Cobot or industrial. If the job is still fuzzy, narrow with Product Advisor, then check worst-case TCP in Comparison. After PO, keep the “6-week integrate” line honest with RooollTrack so it does not drift to 16 weeks in execution.