Quick answer
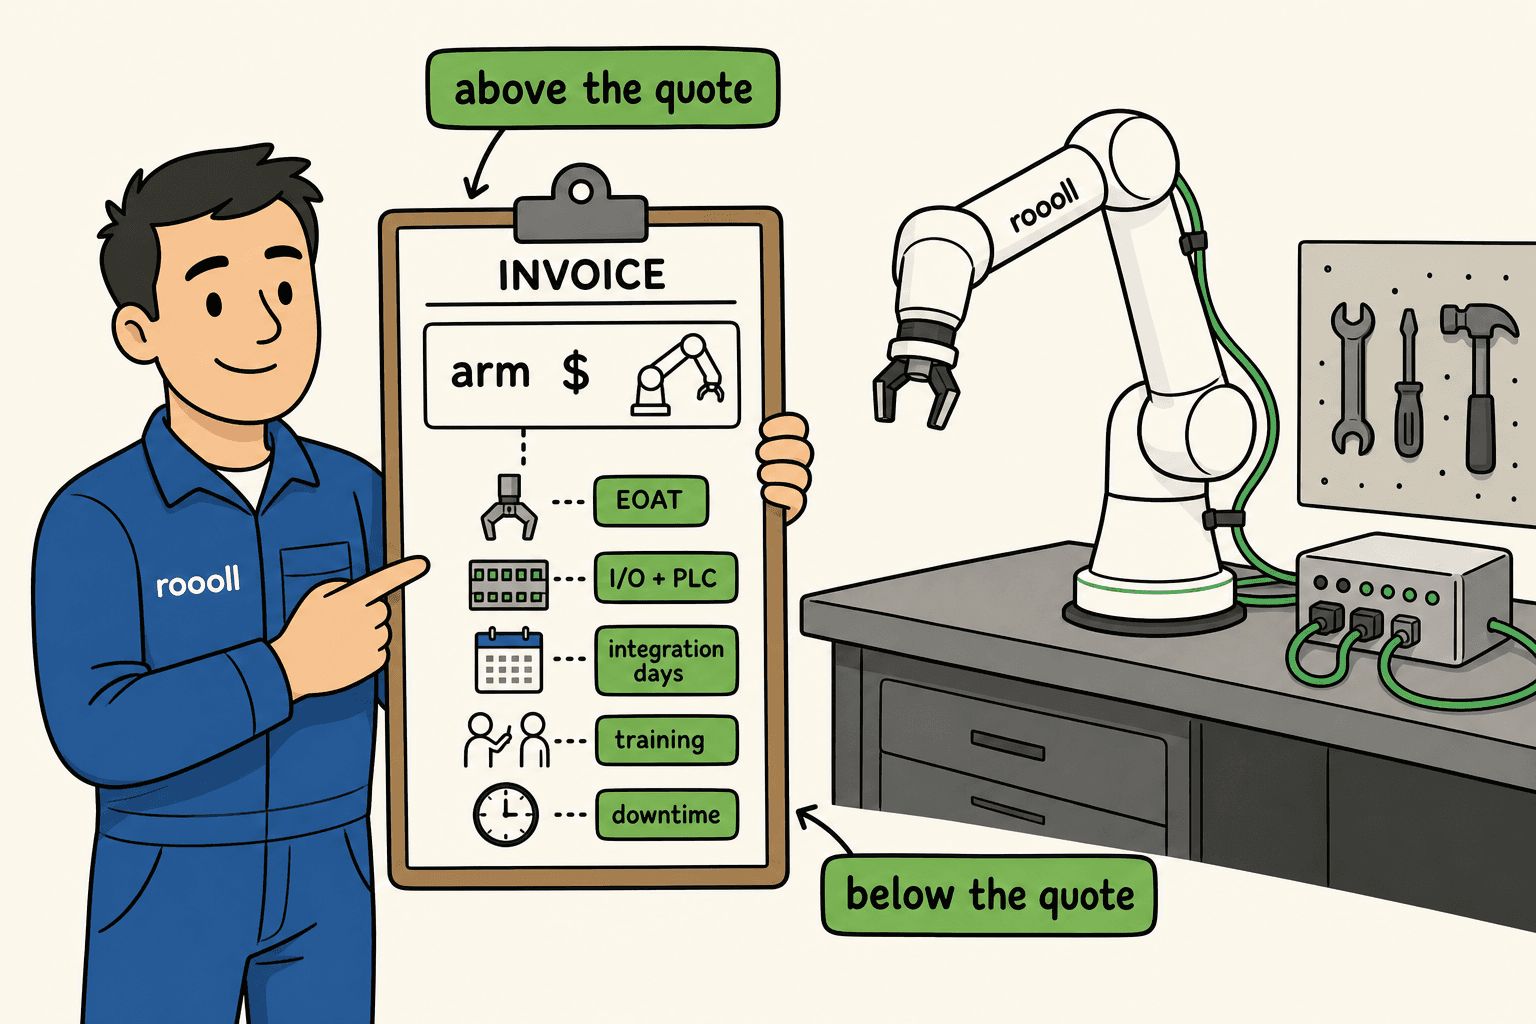
The arm line is easy to remember; below-waterline work is easy to forget—name EOAT, integration, downtime, and training on one ledger before PO
Hardware share: published TCO articles often put robot hardware at ~25–50% of project cost; integration ~30–50%
Full-cell bands: simple cobot cells often ~$45k–$75k; vision/multi-station often ~$70k–$130k
Payback bands: single-shift often ~12–24 months, multi-shift often ~8–14 months—verify on your hours and utilization
Do not build ROI on catalog takt—4 s in demo and 7 s in production breaks payback math
The owner asks ROI, procurement asks payback, engineering asks “please do not blow commissioning.” Those are rarely the same number. We do not sell a magic headline payback. What helps before PO is every cost line and every gain line on one sheet—whether the math lands at eight months or three years, the team shares one ledger.
Published evidence bands (cobot project cost and payback)
| Metric | Published band | Source |
|---|---|---|
| Robot hardware share of project | About 25–50% | AMD Machines · TCO |
| Integration share of project | About 30–50% | AMD Machines · TCO |
| Simple cobot cell | About $45k–$75k (arm + EOAT + integration) | Robotomated cost guide |
| Vision / multi-station cell | About $70k–$130k | Robotomated cost guide |
| EOAT range | About $2k–$40k+ | Robolist · TCO model |
| Typical payback (single shift) | About 12–24 months | Robotomated cost guide |
| Typical payback (multi-shift) | About 8–14 months | Robotomated cost guide |
Size conservatively with fully loaded labor, worst-part takt, and 70–75% year-one utilization—do not contract vendor-ideal uptime.
Gains: do not stop at “save one person”
| Gain | How to rough it | Note |
|---|---|---|
| Direct labor | Released hours × loaded labor rate | Rarely a full headcount delete—often backfill + less overtime |
| Quality / rework | Defect drop × cost per defect | Programmed place often cuts end-of-shift drift |
| Ergonomics | Repetitive bends per shift | Palletizing and tending cells feel this first |
| Asset utilization | Extra spindle or analyzer minutes | → CNC tending guide |
| Changeover | Program edit vs hard-automation retool | Matters when SKUs rotate |
Costs: above and below the quote
Above the waterline — arm, controller (integrated or cabinet), teach pendant, baseline cabling, freight
Below the waterline (often missing on first quote)
| Bucket | Typical scope | Ask |
|---|---|---|
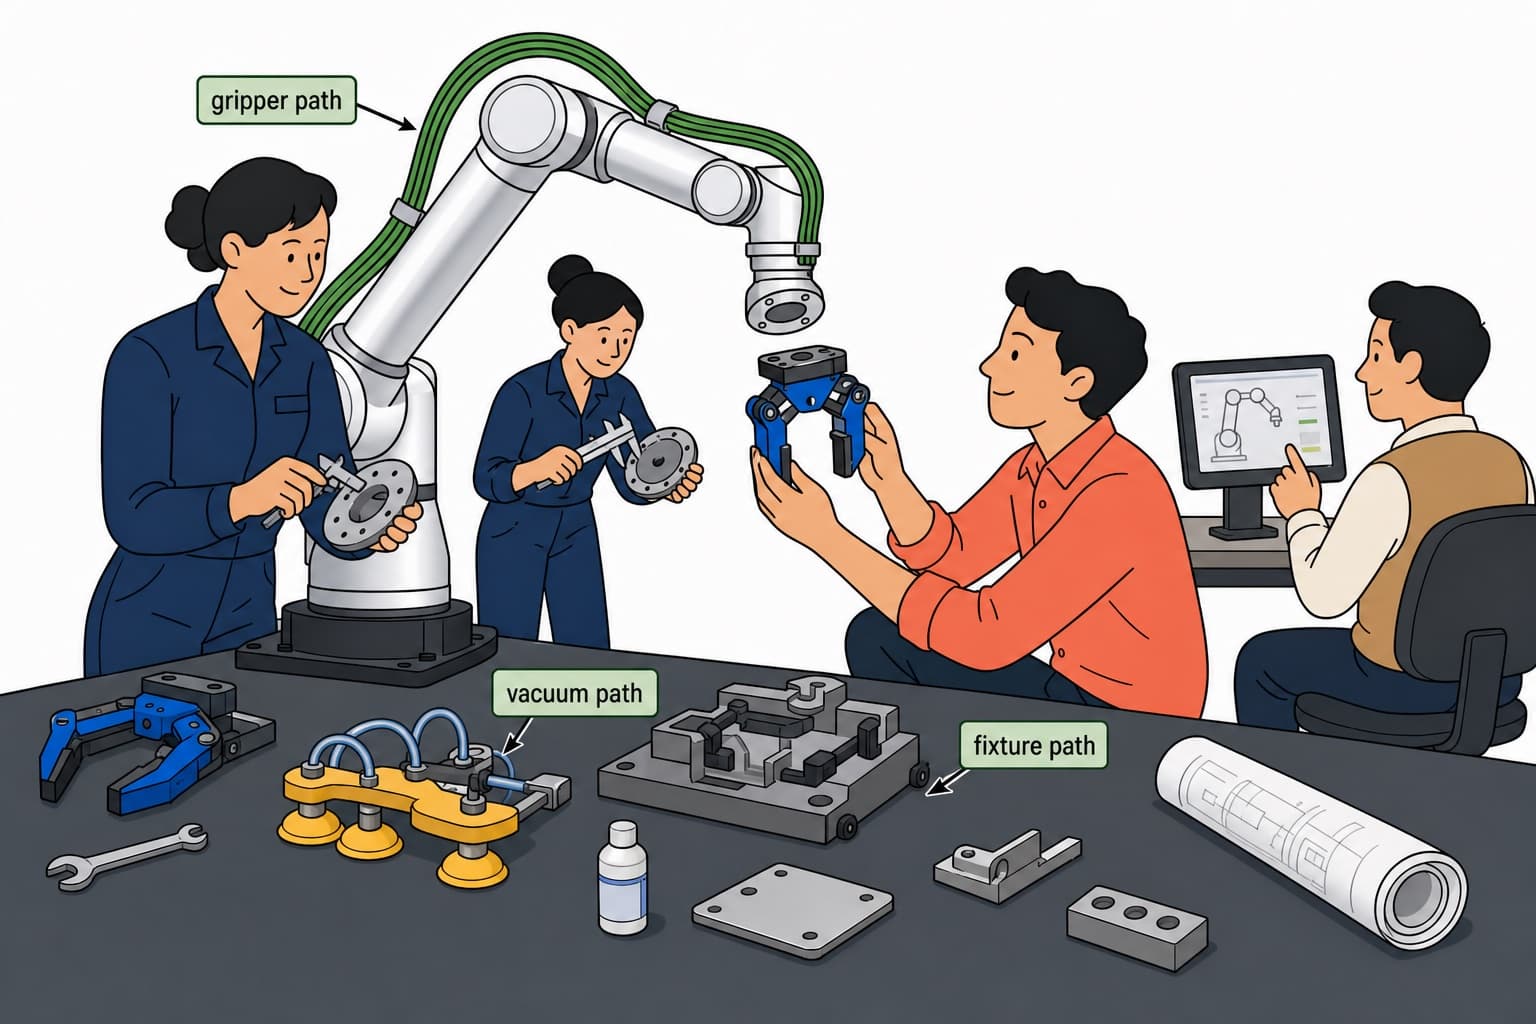
| EOAT | Gripper, vacuum, valve stack, fixture | → End-effector guide |
| Mechanical | Base, bench, guarding, dress | → Workcell layout guide |
| Electrical / I/O | PLC handshake, e-stop, sensors | → Safety & I/O guide |
| Integration labor | Commission, tune, acceptance | → Integration timeline guide |
| Downtime window | Orders not shipped during install | Owners feel this first |
| Training + spares | Who teaches, year-one kit | Who owns month one? |
Why below-waterline work gets skipped → Hidden cost of robot integration
Pre-PO ROI checklist
Copy the four tables into your capex memo or quote thread—an empty cell is usually the line missing from the first quote.
| Gains (fill at least two rows with numbers) | Your estimate / note |
|---|---|
| Releasable direct hours (hours/shift × loaded rate) | |
| Quantified quality or rework improvement | |
| Asset utilization uplift (extra spindle or analyzer minutes) | |
| Changeover time saved | |
| Ergonomics / injury risk (qualitative OK—name the goal) |
| Costs above the quote | Amount or vendor |
|---|---|
| Arm + controller + baseline accessories | |
| Freight, duty, insurance (cross-border) |
| Costs below the quote (often missing first pass) | Amount, TBD cap, or owner |
|---|---|
| EOAT + fixture | |
| I/O / PLC / safety scope (in SOW) | |
| Integration labor + days | |
| Downtime window (orders not shipped) | |
| Trainees + year-one spares |
| Technical sanity (do not build ROI on fantasy takt) | Outcome / link |
|---|---|
| Worst TCP on rated payload | → Payload guide |
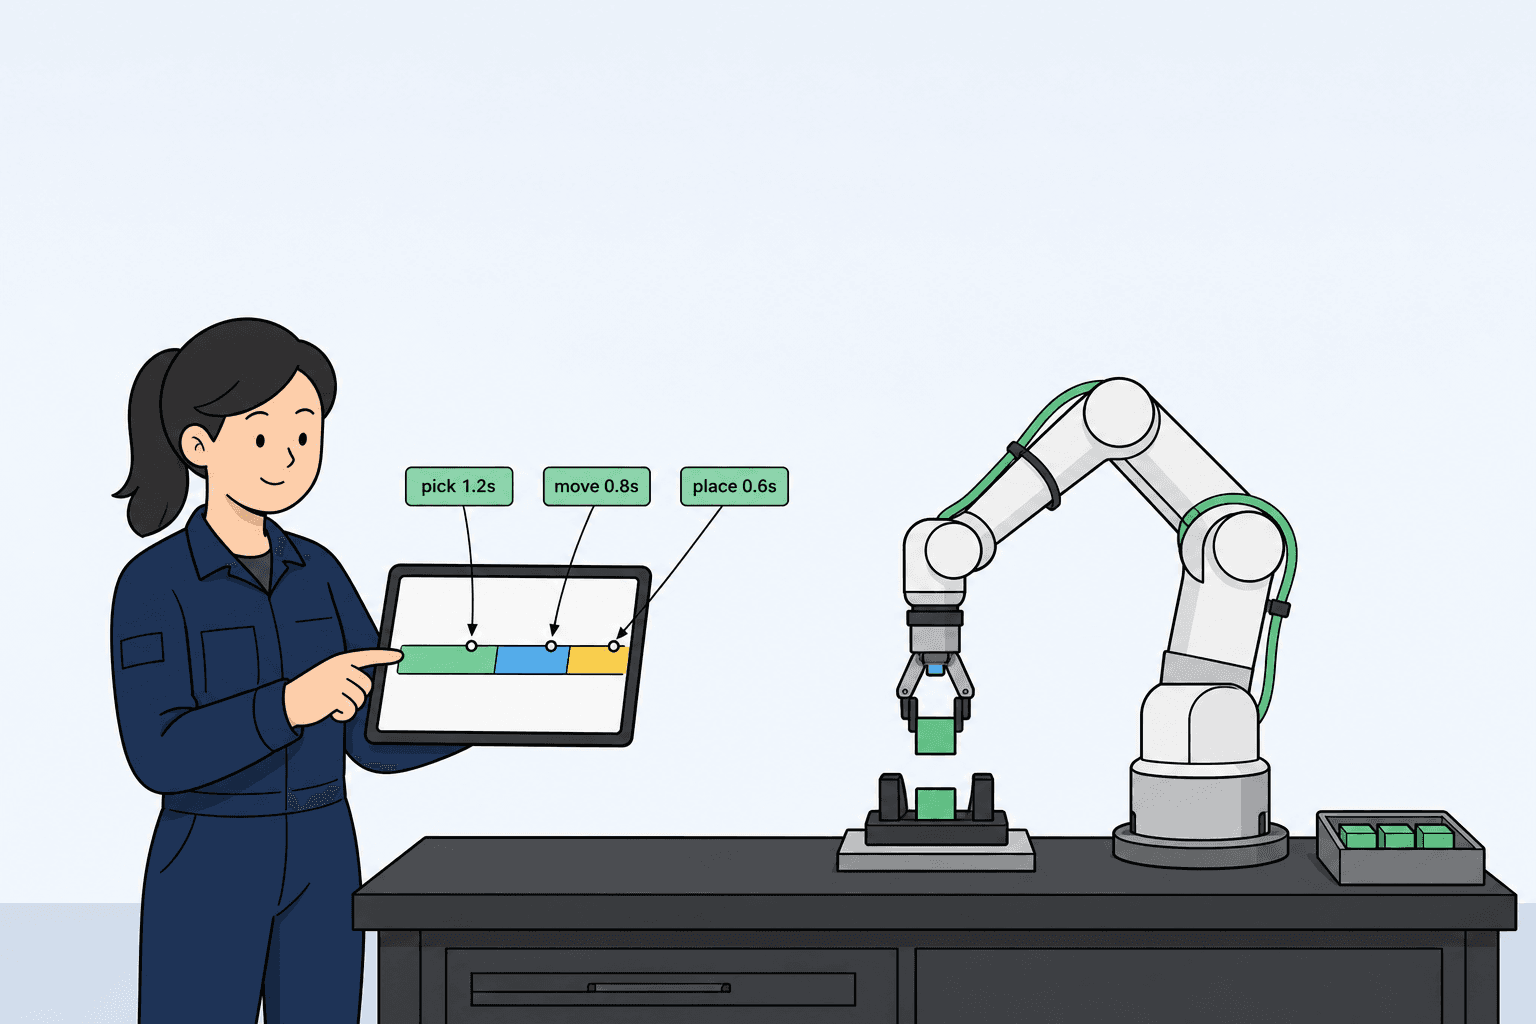
| Stable cycle time segmented (EOAT + waits included) | → Cycle time guide |
| Task readiness scorecard run | → Automation readiness guide |
Worked example (illustrative—swap your numbers)
Published TCO pieces often sum Year 0 as hardware + EOAT + integration + safety. Example: arm/controller $50k + EOAT $8k + integration $20k + safety/I/O $5k → Year 0 $83k. If fully loaded labor is $55k/year and you release 0.7 FTE, annual gain ≈ $38.5k → rough payback ~26 months (before quality/utilization uplift). Multi-shift or spindle-minute recovery can shorten that sharply—see the CNC tending guide bands.
Common traps
Catalog speed inverted into throughput—4 s in demo, 7 s in production
Arm PO signed, EOAT TBD—the gripper-on-a-truck problem
“Save integration” that moves cost to delay
Three spec stories—one comparison URL before PO → Selection mistakes guide